📉 Gantt Chart
Used to measure timescaled and milestones of projects.
Gantt Charts are frequently used in project management
Gantt Charts provide a graphical illustration of a schedule that helps to plan, coordinate, and track specific tasks in a project.
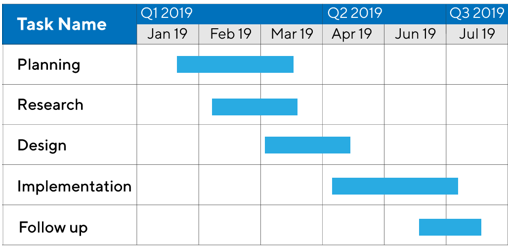
A Gantt chart is a horizontal bar chart used in project management to visually represent a project plan over time as well as who’s responsible—for each task in the project.
- How a project breaks down into tasks
- When each task will begin and end
- How long each task will take
- Who’s assigned to each task
- How tasks relate to and depend on each other
- When important meetings, approvals, or deadlines need to happen
- How work is progressing in a project
- The full project schedule from start to finish